Pair: UNI / USDT
Timeframe: 15-minute chart
Market Condition: Sudden downside volatility (market-wide)
Snapshot: What volatility actually looks like
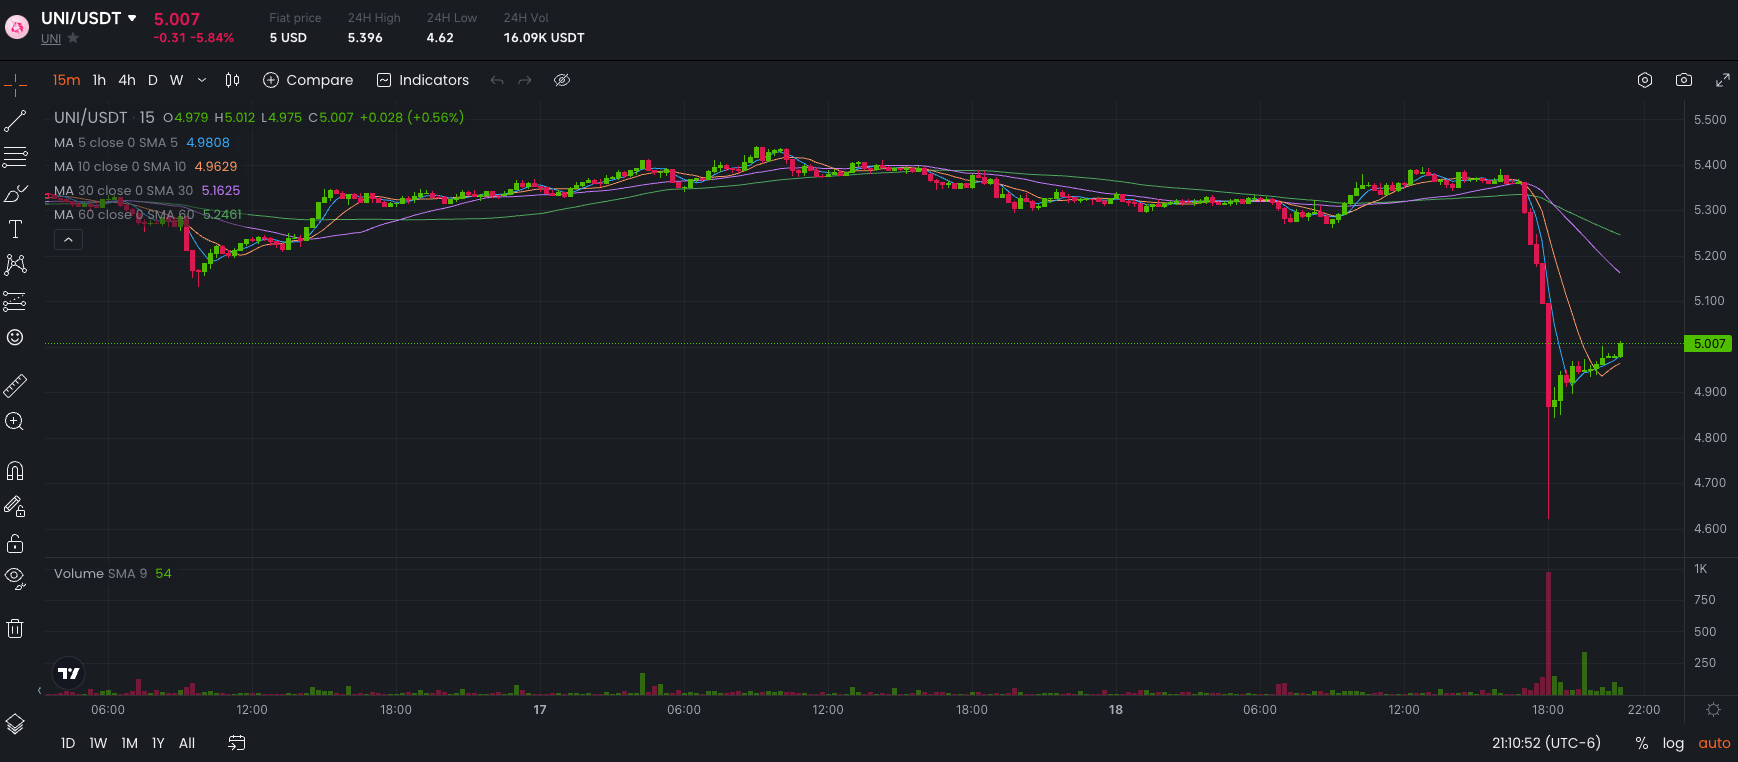
Above: UNI/USDT on the 15-minute timeframe during a market-wide sell-off. A long period of sideways trading is followed by a sharp, high-volume drop and an immediate stabilization.
This snapshot captures the reality of automated trading far better than performance numbers alone.
What happened
UNI experienced a sharp intraday sell-off, dropping from the mid-$5.30s into the high-$4.60s before stabilizing and rebounding toward ~$5.00.
This move aligned with broad weakness across BTC, ETH, and major altcoins — not project-specific news.
What the chart tells us
- This was a volatility event, not a structural breakdown
- Selling was fast and emotional, followed by buyer support
- Volume spiked at the lows, indicating forced selling and liquidity capture
- Price re-entered the prior range rather than establishing a new downtrend
In short: noise, not thesis failure.
Bot behavior (expected)
During the drop, the UNI grid bot:
- Continued placing buy orders as price moved lower
- Temporarily showed unrealized drawdown
- Began recovery as price stabilized inside the grid range
This is normal and intentional behavior for grid strategies.
A grid bot does not avoid volatility — it consumes it.
Key takeaway
Red candles do not mean a broken strategy.
They mean the strategy is being tested.
This event is logged as a volatility stress test, not a failure condition.
Lab note
Automation exists for moments like this.
If a strategy only feels comfortable when charts are calm, it isn’t robust — it’s fragile.